Post FOMC - Trade Analysis

Yesterday's FOMC meeting was nothing short of a celebrity news. Its surprising how some finance portals put their headlines as 'shocking' which is indeed surprising. Are their analysts too smart with their Phd Degrees that they are out of tune with what's actually happening or are they paid to give out false information? A case in point being Barclays which went on to justify why the fed would taper (Read: Trading the 4 Components of Sep. FOMC). Either there's something that i'm missing or perhaps that is the job of 'Sold-Out' economists/analysts who get fat bonuses based on how much of wrong info they give out.

Anyways, moving back to our analysis, yesterday I noticed the Dollar Index, 12 hour chart forming a Wolfe Wave pattern as well. It is bullish in the long term and currently dropping lower to make the wave 5. Needless to say, this basically puts the Dollar index inversely co-related to the EURUSD.

Later today we will see the initial unemployment claims being posted. Bear in mind that last week's better than expected headline reading was skewed on account of under-reporting from some states. So expect a downward revision. Markets should not be reacting adversely but given the insanity, who knows.

Below is the USDX chart, with price now in the 'sweet zone' A reversal could happen but at least not immediately.

Dollar index - Wolfe Wave Pattern, 12H Chart
EURUSD - It might seem like a missed opportunity but it pays to have patience. Euro has also crossed into the 'sweet zone' with upside targets in the region of 1.37 We will have to wait and see how price plays out here. This weekend, Germany, Europe's behemoth will be heading into elections. A Pro-Merkel victory would see the ECB heaving a sigh of relief. But it could be crisis time should the opposite happen. Given the above fundamental view, sitting on the sidelines is the best bet for now.

EURUSD - Wolfe Wave, Price in Sweet Zone
USDJPY - This pair has triggered a sell and our stops reside at 100.59. The first target is going to be 95.95 followed by the final target of 90.7.


USDJPY - Wolfe Wave, in Play

It would be best to book some profits around the first target, move the trade to break even and some pips (to at least cover the negative swaps and/or commissions) and sit back and watch.

Note: I will update the trades on Goldman Sachs and Staples later today. Both of which are shaping up nicely.

Update on charts

No time to write.. so just charts for now... but some food for thought.. the US Debt Ceiling is still due. A reversal is not too far away. More later.

EURUSD - Wolfe Wave Update

USDJPY - Wolfe Wave Update, In Play
Dollar Index - Now in the 'Sweet Zone'

Ahead of the FOMC.. this is what we're looking at!

I've been away, and markets have pretty much stalled ahead of today's FOMC meeting. Taper or not, is the big question. But if you dig deeper the answer is not straight forward, as much as we would like to. Analysts at large are hinting to a taper of 10bn - 15bn. If we read the original intent of Bernanke, we notice that he mentioned tapering would be dependent on data.

So while unemployment has edged to 7.4%, it is still short of the Fed's target of 6.5%. Inflation is also well below Fed's target with last month's inflation coming out at 0.1%. So where does this leave us?
Would the Fed taper, knowing that job participation has dropped and leave room open for more QE if the need arises or would the Fed revise its unemployment and inflation targets? And then there's also the question on Interest rates outlook as well. And last but not the least, the US Debt Ceiling is back in the picture again.

While speculation is all that we can do until the man speaks, here's a quick recap of the trades that we are watching.

The US Dollar Index

The 12 Hour chart gives us a possible Wolfe Wave pattern. It is bullish no doubt but currently the index is aiming lower. I expect a target of 80.50 to be reached (the index is currently at 81.14) before it can reverse and move higher to 83.95. The Estimated Time is 23rd October.

The Dollar Index, 12 Hour Chart - Wolfe Wave Pattern


It would be worth the efforts to keep an eye out on the Dollar Index as it can give us indications into our two trades.

USDJPY - Bearish Wolfe Wave

We continue monitoring the Dollar Yen. Recent price action hasn't been that clear for us to short this trade. The updated chart looks as follows.

There is still some move to the upside left, with the most immediate ceiling coming in at 100.584, 101.527, 103.728 and 104.351. On the downside, we're looking at 95.799, 93.773 and 90.669.

Using the Median line approach, we see price coming out of the pitchfork. Dovish comments today could set in motion the bearish move on the USDJPY.


USDJPY - Daily Charts - Wolfe Wave
Applying Fibs to the recent price move, we notice a confluence of the 50% level with the estimated price of 90.67 - 90.40. If price indeed does get bearish, an entry at 97.427 with stops at 100.583 could see us reaching the target level of 90.67 with other levels in between for scaling out of the position as price goes closer to the target.

USDJPY - Fibonacci Levels
On the contrary, a move higher is likely to see 103 being reached quite easily, provided the 100 psychological level can be taken out decisively.
EURUSD - Bearish Wolfe Wave

While the title might be misleading, in this bearish Wolfe Wave, we are looking at point 5 to be created. Thus, a bullish move before we expect price to reverse. The EURUSD has been in a continued downtrend from a larger perspective. Thus what we're actually looking at (the bullish move) is in fact a correction/pullback rather than an actual rally. Nothing much has changed in regards to the EURUSD and price action is comfortably inside the median line. So there is a probability that price could continue moving higher until it loses strength and starts to reverse.

EURUSD - Daily Charts, Bearish Wolfe Wave
All things said, more than the taper focus should be given to Bernanke's statement which could provide that much needed direction. Dovish Fed comments could keep our analysis on track, i.e: A bullish EURUSD and a bearish USDJPY, and of course a bearish Dollar index. On the contrary, any hint of hawkish comments could make us revisit the above analysis.

I'd be waiting until the statement is released before taking on any trades. Good luck!

Morning Market Brief - 10/09/13

Of the three pairs, EURUSD managed to make some decent moves, having broken the key price point of 1.32375, closing the day higher.

EURUSD - Daily Charts, 10/09/13
Today will be important to see if this level has indeed been breached. A close higher indicates a move to 1.342. 4-hour Stochs are in the overbought area, so there could be some moves to the downside. What matters is the daily close today. I expect a bounce off 1.32316 level and will be watching the 4-hour price action. A 4-hour close below this level along with a bearish stochs could be the first signs of a possible exhaustion in the upside move to 1.34.

EURUSD - H4 Chart
The Yen pairs literally seem to be stuck in a range. Today's early data from China came out modest but better than expected. Nikkei has been positive for most of the Tokyo session.

GBPJPY is looking to break the 156 region. Should that happen, we'll be dropping the GBPJPY pair off our watch list.

The US Dollar Index is down 0.1% at the time of publishing this article. It is looking bearish (since last Friday), currently at 81.73. If this continues, expect the USDX to drop to 81 - 80.50 levels.

US Dollar Index - 09/09/13, Close
In stocks, Staples and GS are looking good on the portfolio for now.

Not much of economic data today or tomorrow, so the Yen pairs could just continue ranging. Congress goes to vote tomorrow in regards to a military strike. Ironic that on the anniversary of 9/11 we have the US planning to vote whether to support the rebels who already have the backing of Al-Qaeda and the bigger irony is that of Obama, a Nobel peace laureate who wants a war, much against international opinion which recommends a UN resolution.

Sep-taper is going to turn out interesting. More and more editorials coming out trying to understand the recent jobs data. The general take away is that the unemployment rate dropped due to reduced work-force participation, furthermore a downward revision of June/July figures hints a slow recovery phase. Fed might be looking at a small taper of $10bn. There's also the talk of the famed US Debt Ceiling end of September. Contrarian views suggest Bernanke would hold off any taper at least until the debt ceiling issue (which the US Congress famously is known for burning the midnight oil) is resolved, which could mean we'll be looking at a possible Octaper?? Also concerns from emerging markets on capital flight needs to be taken into consideration, least it spirals into another crisis rubbing off from one economy to another.

Goldman Sachs is a Buy and Hold!

A month ago, I was monitoring Goldman Sachs stocks and came across a Wolfe Wave pattern. Back then the Wolfe wave was still in its initial stages but showed promising signs of a trade both counter trend and the longer term up trend.

The trade was successfully closed and price reversed just in the sweet spot. I'm now long Goldman Sachs, targeting $200, which is due to hit towards end of the year. I must admit though that I was late in entering this trade as the reversal happened just a few days ago. However, better late than never, considering current price is at $160.

Below is the chart of the original trade:

Goldman Sachs - Counter trend trade, Wolfe Waves
There was a small modification to the point 3 which overshot the original price level by a few points but still kept us in the trade. Below is the modified Wolfe Waves for Goldman Sachs, which points to a target of $203 with a target date of 11th November.

Goldman Sachs - $203 projected price - Wolfe Waves

Follow Up: GBPJPY, USDJPY, EURUSD

The USDJPY saw a mild rally during today's Asian session. Markets were boosted after Tokyo won the bid to host the 2020 Olympics. Economic data released earlier in the day saw the GDP figures pointing to a slow increase to 3.8% annualized rate.

However, as the European session opened, the Yen started gaining modest strength. In the absence of any major economic data for the rest the day, its quite likely for the USDJPY to be ranging rather than make any sudden big moves.

The pair is still at our key level. The Stochs currently at an overbought level sloping downwards indicating a possible move to the downside. We will continue watching this pair for now.


USDJPY - Wolfe Wave Updates
EURUSD: The EURUSD analysis was posted on Investing.com. You can read about the updated EURUSD analysis here. The key take-away is the 1.32375 level.

GBPJPY: This pair has been ranging for quite a while and has pretty much made up its losses post NFP last Friday. We also need to adjust the Wolfe Waves quite a bit. However, the bias remains the same, which is a long term upward bias with price action currently forming the point 4. So we expect a ride down to point 5 and then a rally higher.

GBPJPY - Updated Wolfe Waves

Update: GBPJPY, USDJPY, EURUSD

We continue to watch the above three pairs and so far, with the exception of USDJPY, we have had to make some minor adjustments for GBPJPY and EURUSD.

GBPJPY: After plotting the previous Wolfe Wave, a key price level was the 156.768, which was point 2 of the Wolfe wave. Price managed to breach point 4 but only by a few pips and short of the key price level.

A short position initiated at this reversal point is staying up with stops at 156.768. It is likely that price action will continue downwards to 150.453 and 147.574.

Below is the updated Wolfe Waves for GBPJPY.


GBPJPY - Updated Wolfe Wave
EURUSD: EURUSD showed a bit of confusion but so far price action is respected the trend line 2 - 4. However, given that today is the NFP release, it will be interesting to see how it will play out. There is still room for the downside, so long as price doesn't fall below 1.286 which infact is the estimated price target.

It is quite likely that we will have to re-adjust the EURUSD wolfe waves later this month, given the FOMC minutes due later in September.


EURUSD - Re-adjusted Wolfe Wave with further room to the downside
Possible Price Moves during today's NFP.

The downside targets are 1.30213, which forms the 61.8% retracement. A break below this level and a further drop would be a first indication of a possible invalid Wolfe Wave.

EURUSD - Downside Moves during today's NFP release

USDJPY: No change. Wolfe Wave still intact. Watching for a breakout.

USDJPY - Wolfe Wave, Intact

USDINR - Upside bias still intact

The Indian Rupee has been the most talked about currency from the emerging markets, having gained the notoriety of being the most worst performing currency, only next to the South African Rand.

The Indian Rupee has been in a continued uptrend since July 2013, which co-incidentally happens to be the month where the US Federal Reserve announced its intentions for a possible taper to its QE3 program. As we draw close to this September's FOMC meeting, which is quite likely to be 'THE FOMC MEETING' of this year, there is a certain sense of anticipation in regards to the Indian Rupee.

The Indian Government has been trying its best to curb this sharp rise in the currency; falling short of imposing capital controls in an effort to boost FII. However, it seems whatever efforts that will be taken up by the Indian Government, it is only too little too late.. stressing on the 'too late' factor rather than doing too little.

For investors looking at the USDINR pair, this week is quite important and could perhaps set the tone for at the very least the near-term direction for the Rupee.

USDINR - Daily Chart
Note that the peak was formed just a few days ago with the USDINR shooting up to 69.08 against the US Dollar. After reaching this peak, price action moved lower revisiting a familiar region of 65.69 (not highlighted in the chart). This base has formed a fair support for quite a while. A break of this support level will see the Rupee strengthen with the likely test of the next base at 63.5 - 62.5 and finally the more comfortable levels at 59.


USDINR - Supply/Demand Zones, Daily Chart
Given the current underlying fundamentals in place it seems like a herculean task for the pair to drop to the 59 levels unless the base at 63.5 gives way.


USDINR - Projected Price, H4 Charts
A closer inspection of the chart plotting Wolfe waves paints a rather disturbing picture for the Rupee. The bullish Wolfe waves show a price projection towards the region of 70's (71.20). We currently have the 4 wave points being formed and in regards to the sweet zone we see price action gently touching the region of 65.3. The moving averages of 8 and 21 has currently generated a bearish cross over, signalling a decline in prices on the 4-hour chart.

Early indications of a bullish move would be positive US data due out later today (refer to the end of the article, US Fundamentals for the key US economic data to watch)


Alternative Scenario - Failure of the Wolfe Wave

A failure of the Wolfe wave (which means price breaking 65 level) will see a decline towards 63.75 - 63.10. This level is clearly a very strong support level which is unlikely to be broken. The same can be identified by plotting fibs, which shows this region having strong confluence of various smaller wave fibs. Thus, there is strong reason to believe that price will find it hard to drop below 63.

USDINR - Fibonacci Support, Daily Chart
Finally, using speed lines we find that price action tested the one-third line at 65.51, which seems to be holding as a support level. A bounce off this support trend line is likely to indicate a continued upward bias for the Rupee. A break below this trend line followed by a retest of the level, if it holds is an indication that price action will be heading lower and thus alert us for the next key level of 63 to watch.

USDINR - Long Term Speed Resistance Line
To summarize our Technical Analysis of USDINR pair:
  • There is an upward bias that is still intact
  • Wolfe Waves project an upward target of 70 provided the price level of 65.66 holds which is also the price level for the longer term speed resistance line (1/3rd)
  • In the likelihood of a break below 65, price will be looking at 63 to establish a base, which is yet another strong floor
  • A break below 65 is likely to create this region as the new ceiling thus limiting any upward moves
US Fundamental Data

Key US data includes ADP payroll numbers, ISM Non-Manufacturing PMI data and weekly unemployment claims report due out later today. Any positive data is very likely to increase bullish pressure on the US Dollar. On September 6th we have the US Non Farm payroll data with the consensus pointing towards 177k (revised downward from previous actual reading of 166k). Actual data which shows an improvement from the estimates is going to see the USD react very bullishly. The US unemployment rate is likely to remain unchanged at 7.4%

Later this month, on September 18th the FOMC minutes will be released, hopefully shedding more light on the very essential tapering. General consensus being towards a mild tapering of US Treasuries and MBS purchases (from $45bn and $40bn to $35bn and $30bn respectively).

Last but not the least, the impending US Congress vote on a military strike on Syria is quite likely to add to a bullish US Dollar and also a potential increase in prices of Crude Oil.

To conclude, the US Dollar is set to look bullish and unless the Indian Government and the RBI come up with an effective monetary policy it is quite likely for the Indian Rupee to continue flirting the levels of 62 - 65 for the rest of this year.

Watching EURUSD - Short

The daily charts of EURUSD show an ideal Wolfe Wave in the making. From the chart below we have points 1 through 4 being formed with current price action 'hopefully' racing towards making a peak at Point 5.

EURUSD - Daily Charts, Wolfe Waves
By using Median line we notice we do not yet have a confirmation towards point 5. A break of the down sloping median line will provide the much needed validation, which is depicted as the shaded area.

EURUSD - Wolfe Wave Point 5 - Validation Criteria
The same validation can also be seen by plotting a median line sloping upwards, connecting Wolfe points 2, 3 and 4. From this median line we would be looking to take a short position as soon as this upward sloping median line is broken, with an early indication coming through when price action starts moving away from the inner median line.

EURUSD - Short Trade Set up
With this trade set up, we take our total count of potential trade set ups to 3. Other analysis can be found here for USDJPY and GBPJPY

Watching GBPJPY for a short (Wave 5)

The Sterling Yen daily chart formed a Wolfe Wave with currently the 4 wave points being in place. We see a bullish wolfe wave with current price action looking to drop to create Wave 5 and possibly enter the sweet zone.

Watching GBPJPY - Bullish Wolfe Wave
Shorting this pair would be a risky yet rewarding opportunity, with the ideal stop levels being at 156.768 with target levels at 150.453 and 147.726 respectively.

The bullish Wolfe wave shows a projection of 164.570 to be formed by the year end. Thus traders should pay attention to price action once the GBPJPY pair runs into the regions of 150 - 147/145.

The short trade which is basically a counter trend trade can also be validated by using median lines as shown in the chart below. In this case we have the potential target level at 149.641 from where we can expect a bounce and ideally drop to 146.1 before which we can expect to see the bullish price action.

GBPJPY - Short Sell Price Objectives

Watching USDJPY for a short

I was brought to the attention of USDJPY based off a friend's trade who is currently long and targeting 103. Curiosity got the better of me and I started scanning through the various time frames and the daily charts caught my eye.

In the chart below, we see a bearish Wolfe Wave being formed. So far, we have points 1, 2, 3 and 4 with price currently running up to make a peak at point 5 (which hopefully will be 103, for the sake of my friend).

USDJPY - Daily Charts, Bearish Wolfe Wave
The Wolfe Wave's ETA and EPA line shows a 30th September with a price target of 90.529, which is quite interesting. What would make this trade ideal is to short it around 103 with a target of 91/92 which should make a very healthy profit.

For now, we'll continue monitoring this chart.

By adding the median line to confirm the current run up to point 5, we see the ML being broken. Depending on how long it takes, the possible target region for price reversal could be anywhere between 101.513 and 103.728. Of course a break of this region would invalidate our analysis.

USDJPY - Bullish Price targets
 Applying the same median lines to figure out an early reversal at point 5, we currently see price action moving within the Median line. It would be ideal to revisit this trade probably early next week especially when the central bank speeches are more done with in order to get a sense of direction and to pursue this trade further.

USDJPY - Monitoring Price Action

XAGUSD - Wolfe Wave & Median Line (Example Trade)

While browsing through some charts, I came across the silver charts and the H4 time frame showed a great example (in hindsight) on a perfect combination of Wolfe wave and median line.

The chart below shows the Bullish Wolfe Wave and how price moved in line with the EPA trendline. A quick glance of this chart shows a soft point 5 being created before price resumed a bullish run. It should be easy to note from this formation that traders would have missed taking a position well until price moved out of the upper trendline (TL2-4).

XAGUSD, H4 - Bullish Wolfe Wave
Keeping the chart the same, we now introduce Median lines to gain an idea in regards to a price reversal. By introducing the Median Line we can now see how this helped alert us for a possible change in direction, which would have been a bit more difficult (thus resulting in a delayed entry) if we traded purely on Wolfe Waves.

We notice that first price failed to breach through the Median line which was the first warning sign that a potential 'Point 5' on the Wolfe Wave was being formed. (Note that I did not plot a TL2-4 parallel line from point 3 in this case). We now get a confirmation of a potential change in direction within this 'Sweet zone' so we then look for a validation of our long trade entry.

We see price gradually moving away from the Median line. Price breaks the outer median line, goes back to retest the breakout region and proceeds higher, moving to the price range of the EPA.

XAGUSD - Wolfe Waves and Median Lines
Now that we have our entry price and the stop loss (which is a few pips below point 5), we'll look to median lines again for our profit levels. If we were to go by Wolfe wave price targets, the trade would have given a risk-reward ratio of 1:1.9. While this might seem a decent enough trade, considering price managed to reach the EPA level of 24.332, we notice when using Median lines that the upward move wasn't complete yet (we this because price continued to move within an upward channel, edging closer to the median line). If we trailed our stops with exit level pointed on prices on the lower median line, the entire trade would have given us a 1:2.1 ratio exiting our trailing stop at 24.523.

XAGUSD - Median Lines for TP levels

Follow Up - Wolfe Waves & Median Lines

This is a follow up post to the previous trade analysis using the Wolfe Wave/Median Lines methodology for the following trades:

EURUSD
GBPUSD

In this trade analysis, i'll also put in another trade which I didn't mention previously, which is the CADJPY. What makes me to bring out the CADJPY analysis is the Wolfe Wave Failure pattern which was identified earlier on with the help of median lines.
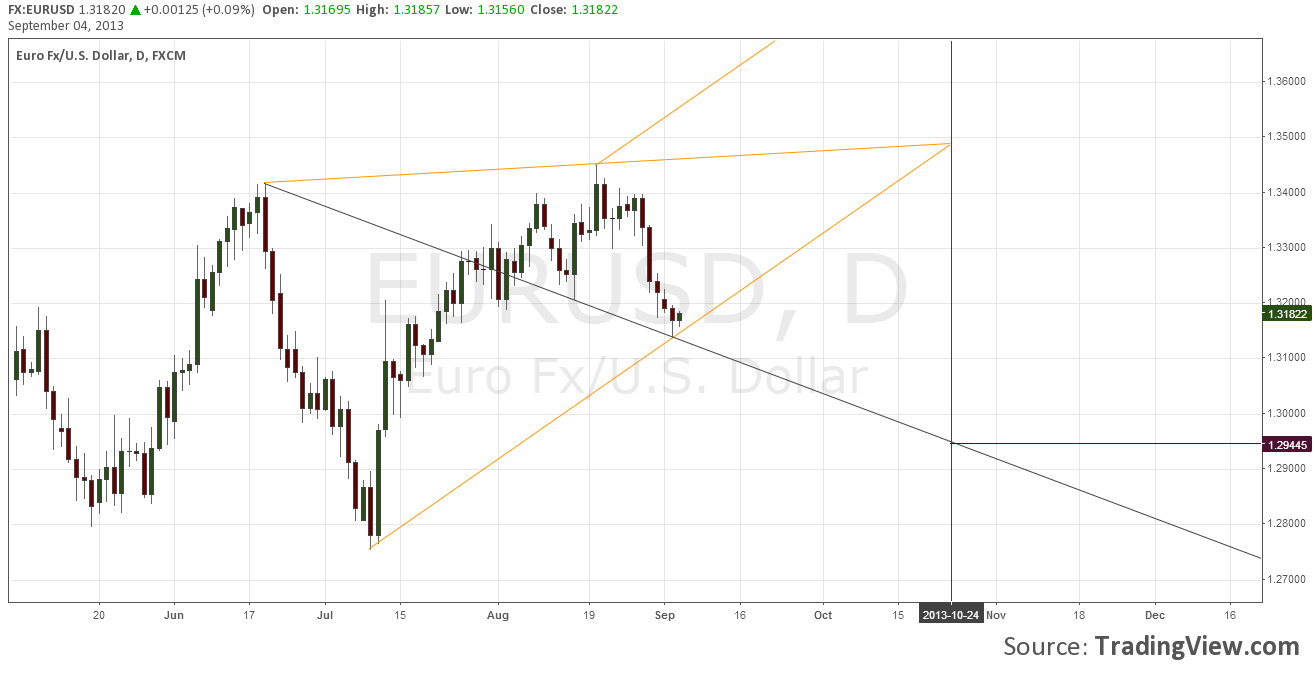
EURUSD - Trade Analysis

In the EURUSD, we were looking at a bullish Wolfe wave to go long. At the time of writing the trade analysis, we had the Wolfe wave point 4 that was formed, and thus waiting for the bearish run towards point 5 in order to initiate a long position.

In the chart below, the arrow shows the region where the bearish run towards marking point 5 started. It could have been ideal to short the pair at this point in time with the obvious price target at 1.32041 which was reached.

EURUSD - Wolfe Waves/Median Lines
The second arrow shows us how price was pretty much contained within the TL2-4 Parallel line.

Going long EURUSD???

From the above chart, now would be ideal to take a long position on EURUSD. But the question is what would be the price points and the targets. In order to find out our long entry, we'll plot a new median line with points 2, 3 and 4 from the Wolfe wave. However, the median line with the above reference points shows price action outside of the median line, which means that we need to adjust the median line.
EURUSD - Median Lines with 2, 3, 4 WW as reference points
So we look for the next relative high which is the next peak after the pont 4 on the chart and plot the new median line as shown in the chart below.

EURUSD - Manually adjusted Median Lines
From the above chart we can now ascertain our price targets. There are some important points to note however.

Conservative Approach: A long position is taken when price action moves out of the upper median line, thus giving us an entry price at 1.329 - 1.324, with stops at 1.32041. The price targets would be 1.340 and 1.345

Reasons: We take this conservative approach because we need a validation that the current bearish run is complete and thus the median line would tell us about a possible change in the short term trend.

Aggressive Approach: This long position would be initiated based off the assumption that the point 5 in Wolfe wave has been formed. It is risky but offers traders the chance to make more pips. From this perspective, our price entry point would be the region where the candle opens above the inner median line (1.322 - 1.324) with stops placed a few pips below 1.317 which was the lowest point. The price targets remains the same though.

Reasons: In the aggressive approach, we're entering the trade 50 pips ahead of the confirmation without getting any validity from the median lines about a change in trend.

GBPUSD - Trade in play

There isn't much to write about this trade as we took on the trade based off the daily charts. So far we are just a few pips away from our entry price in the positive.


GBPUSD - Bearish Wolfe Wave, Trade in play
Revisiting this trade, we can also identify new price targets which is 1.5247, 1.510 and finally 1.48117. I will update on this trade in a later post.

CADJPY - Wolfe Wave Price Failure

The CADJPY pair was showing a bearish wolfe wave on the 4-hour chart. At the time of analysis, we had point 4 being formed which meant a bullish run towards point 5 and preparing us to take on a short position from the sweet zone (in the region of 96.285 - 95.344).

We however notice a price failure and thus point 5 wasn't reached. While general convention states that it is not advisable to take a position from point 4 - 5, at times this strategy can prove to be quite profitable.

CADJPY - Wolfe Wave Price Failure
The median lines however indicated to us an early warning of price failure. As we can see from the chart, price was supposed to move up and then drop from point 5. We get an early indication though as you can see how price moved out of the median line thus telling us of a potential wolfe wave price failure.