The Indian Rupee has been the most talked about currency from the emerging markets, having gained the notoriety of being the most worst performing currency, only next to the South African Rand.
The Indian Rupee has been in a continued uptrend since July 2013, which co-incidentally happens to be the month where the US Federal Reserve announced its intentions for a possible taper to its QE3 program. As we draw close to this September's FOMC meeting, which is quite likely to be 'THE FOMC MEETING' of this year, there is a certain sense of anticipation in regards to the Indian Rupee.
The Indian Government has been trying its best to curb this sharp rise in the currency; falling short of imposing capital controls in an effort to boost FII. However, it seems whatever efforts that will be taken up by the Indian Government, it is only too little too late.. stressing on the 'too late' factor rather than doing too little.
For investors looking at the USDINR pair, this week is quite important and could perhaps set the tone for at the very least the near-term direction for the Rupee.
Note that the peak was formed just a few days ago with the USDINR shooting up to 69.08 against the US Dollar. After reaching this peak, price action moved lower revisiting a familiar region of 65.69 (not highlighted in the chart). This base has formed a fair support for quite a while. A break of this support level will see the Rupee strengthen with the likely test of the next base at 63.5 - 62.5 and finally the more comfortable levels at 59.
Given the current underlying fundamentals in place it seems like a herculean task for the pair to drop to the 59 levels unless the base at 63.5 gives way.
A closer inspection of the chart plotting Wolfe waves paints a rather disturbing picture for the Rupee. The bullish Wolfe waves show a price projection towards the region of 70's (71.20). We currently have the 4 wave points being formed and in regards to the
sweet zone we see price action gently touching the region of 65.3. The
moving averages of 8 and 21 has currently generated a bearish cross
over, signalling a decline in prices on the 4-hour chart.
Early indications of a bullish move would be positive US data due out later today (refer to the end of the article, US Fundamentals for the key US economic data to watch)
Alternative Scenario - Failure of the Wolfe Wave
A failure of the Wolfe wave (which means price breaking 65 level) will see a decline towards 63.75 - 63.10. This level is clearly a very strong support level which is unlikely to be broken. The same can be identified by plotting fibs, which shows this region having strong confluence of various smaller wave fibs. Thus, there is strong reason to believe that price will find it hard to drop below 63.
Finally, using speed lines we find that price action tested the one-third line at 65.51, which seems to be holding as a support level. A bounce off this support trend line is likely to indicate a continued upward bias for the Rupee. A break below this trend line followed by a retest of the level, if it holds is an indication that price action will be heading lower and thus alert us for the next key level of 63 to watch.
To summarize our Technical Analysis of USDINR pair:
Key US data includes ADP payroll numbers, ISM Non-Manufacturing PMI data and weekly unemployment claims report due out later today. Any positive data is very likely to increase bullish pressure on the US Dollar. On September 6th we have the US Non Farm payroll data with the consensus pointing towards 177k (revised downward from previous actual reading of 166k). Actual data which shows an improvement from the estimates is going to see the USD react very bullishly. The US unemployment rate is likely to remain unchanged at 7.4%
Later this month, on September 18th the FOMC minutes will be released, hopefully shedding more light on the very essential tapering. General consensus being towards a mild tapering of US Treasuries and MBS purchases (from $45bn and $40bn to $35bn and $30bn respectively).
Last but not the least, the impending US Congress vote on a military strike on Syria is quite likely to add to a bullish US Dollar and also a potential increase in prices of Crude Oil.
The Indian Rupee has been in a continued uptrend since July 2013, which co-incidentally happens to be the month where the US Federal Reserve announced its intentions for a possible taper to its QE3 program. As we draw close to this September's FOMC meeting, which is quite likely to be 'THE FOMC MEETING' of this year, there is a certain sense of anticipation in regards to the Indian Rupee.
The Indian Government has been trying its best to curb this sharp rise in the currency; falling short of imposing capital controls in an effort to boost FII. However, it seems whatever efforts that will be taken up by the Indian Government, it is only too little too late.. stressing on the 'too late' factor rather than doing too little.
For investors looking at the USDINR pair, this week is quite important and could perhaps set the tone for at the very least the near-term direction for the Rupee.
 |
| USDINR - Daily Chart |
 |
| USDINR - Supply/Demand Zones, Daily Chart |
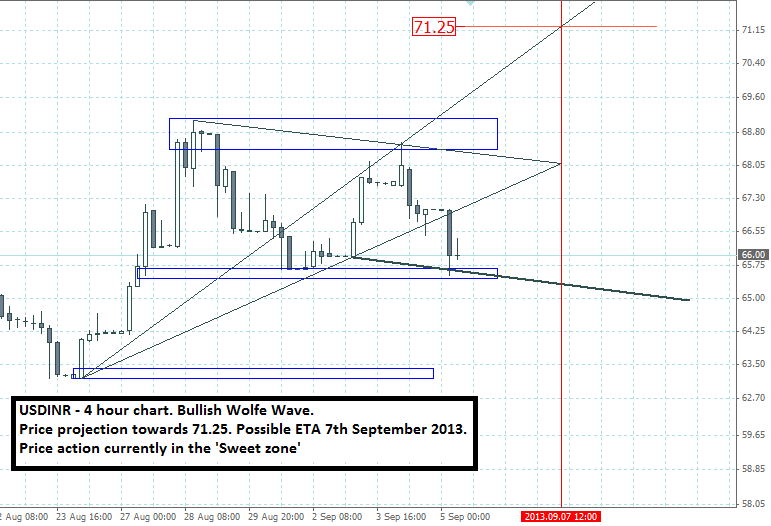 |
| USDINR - Projected Price, H4 Charts |
Early indications of a bullish move would be positive US data due out later today (refer to the end of the article, US Fundamentals for the key US economic data to watch)
Alternative Scenario - Failure of the Wolfe Wave
A failure of the Wolfe wave (which means price breaking 65 level) will see a decline towards 63.75 - 63.10. This level is clearly a very strong support level which is unlikely to be broken. The same can be identified by plotting fibs, which shows this region having strong confluence of various smaller wave fibs. Thus, there is strong reason to believe that price will find it hard to drop below 63.
 |
| USDINR - Fibonacci Support, Daily Chart |
 |
| USDINR - Long Term Speed Resistance Line |
- There is an upward bias that is still intact
- Wolfe Waves project an upward target of 70 provided the price level of 65.66 holds which is also the price level for the longer term speed resistance line (1/3rd)
- In the likelihood of a break below 65, price will be looking at 63 to establish a base, which is yet another strong floor
- A break below 65 is likely to create this region as the new ceiling thus limiting any upward moves
Key US data includes ADP payroll numbers, ISM Non-Manufacturing PMI data and weekly unemployment claims report due out later today. Any positive data is very likely to increase bullish pressure on the US Dollar. On September 6th we have the US Non Farm payroll data with the consensus pointing towards 177k (revised downward from previous actual reading of 166k). Actual data which shows an improvement from the estimates is going to see the USD react very bullishly. The US unemployment rate is likely to remain unchanged at 7.4%
Later this month, on September 18th the FOMC minutes will be released, hopefully shedding more light on the very essential tapering. General consensus being towards a mild tapering of US Treasuries and MBS purchases (from $45bn and $40bn to $35bn and $30bn respectively).
Last but not the least, the impending US Congress vote on a military strike on Syria is quite likely to add to a bullish US Dollar and also a potential increase in prices of Crude Oil.
To conclude, the US Dollar is set to look bullish and unless the Indian Government and the RBI come up with an effective monetary policy it is quite likely for the Indian Rupee to continue flirting the levels of 62 - 65 for the rest of this year.
No comments:
Post a Comment