EURJPY - A Cautious Approach

The EURJPY Daily and H4 charts shows two Wolfe Wave Patterns, and both contradictory to each other. While the H4 Wolfe Wave pattern shows an upward bullish bias, the Daily chart shows a bearish bias.

The extremities in price shows a possible rally to the 126 price region on the four hour chart while the Daily chart shows a target price around the 98 price region.

So how do we trade such kind of a set up?


The first place to look for is to understand what the Schaff Trend Cycle is telling us.


EURJPY - H4 Chart Shows a Bull Run

On the H4 chart we see a bullish bias formed on the Schaff Trend while the Daily chart shows a bearish bias. One way to interpret this is to assume that price would rally a bit more before turning bearish. From the H4 chart, we see that after price dropped to the 38.2% Fibonacci level, price managed to rally all the way to the 61.8% region. Given that both Wolfe Waves and Schaff Trend analysis are inconclusive, we will have to look to the Fibonacci levels to give a sense of direction.

EURJPY Daily Chart shows a bearish formation
One would assume that price is currently retracing and we can expect to see a bearish rally that could possibly breach the 38.2% level and head to the 23.6% region of 116.883.

From a fundamental perspective, the week ahead is packed with economic events for both the EUR and JPY currencies, starting Monday when we will see economic data from Europe, starting with the Spanish unemployment report along with Thursday when we will have the BoJ's monetary policy statement.

A risky trade would be to wait until H4 Schaff Trend shows a bearish biash and the Daily chart is still bearish. However, this trade would have to be taken with caution because we have the 120.622 as a strong level of support, hinting at a ranging price.

Taking all the above into consideration, it would be sensible to stay off this pair for the moment until a proper direction is formed.

Trade Analysis, USDCHF, GBPCHF, EURUSD

Follow up to the trade set ups for the above pairs posted here, this is an analysis of these trades.

USDCHF - It seems like the pair is running out of steam. On the daily charts, we see price coming quite close to the 0.94624. In my analysis I mentioned that price could touch 0.93426. So this was a good trade. For now, we will wait until end of Monday or Tuesday to see if there is any new Wolfe wave patterns coming up.

GBPCHF - Our target price of 1.42887 hasn't been reached yet. We saw a bit of a bearish run to 1.40943 area. As I mentioned a potential entry at 1.41547, price is currently at 1.41642. The 76.4% level at 1.42104 needs to be breached in order to reach our target price. On the contrary, we could see price drop to 1.41120 area before going back up again. On the H1 chart, we have the 50% Fib level at 1.41493 and also we need to wait for the Schaff Trend Cycle to turn bullish. There is still some time for traders to enter this trade.

EURUSD - We expect this pair to drop sharply, however, there was a bit of a bullish run towards close of markets on Friday. The H4 chart still shows a bearish bias, but it can get tricky because on the H1 chart, we noticed a bullish climb on the Schaff Trend. Either ways, I don't expect EURUSD to go beyond 1.30763.

Wait for the H1 to turn bearish to get back into the trade with Stops placed at 1.3058

Wolfe Wave Trade Set ups - 3rd March

GBPCHF - H4 Chart, Potential LONG

The 4 hour GBPCHF chart has a wolfe wave already formed. A confirmation can be taken from the sharp change in Schaff Trend Cycle, at Wave 5. However, the Fibonacci Level of 76.4% or 1.42104 was tested and proved to be a strong resistance. A breach of this level will see price heading to 1.42925.

An ideal trade set up would be to wait for a breach of the 76.4% level, preferably a candle opening above this level with stop placed at 1.40926 and take profit at 1.42925.

In terms of risk to reward, this is a risky trade, but the price is likely to be hit. With a bit of caution and monitoring the chart in real time could help in placing a more conservative stop loss.


On the H1 chart, we see another target being formed at 1.42016. A breach above this level should give us the confirmation to go long. Also bear in mind that the Shcaff Trend Cycles for both H1 and H4 are still bearish, so we will wait until the cycle turns bullish.


CHFJPY - Daily Chart, Potential SHORT

The daily chart shows us a wolfe wave being formed along with the Schaff trend cycle confirming a reversal. The potential target for this trade could well be the 91.498, along with the possibility of price further heading down to 89.632.


If we check on shorter time frames, we notice the H1, H4 still showing a bullish bias on the Schaff Trend cycle. Waiting for a bearish turn of the cycle will provide an ideal entry point, which is likely to be between 50% and 38.2% regions.

A stop loss at 101.859 looks safe.

USDCHF - Trade Analysis, 01/03

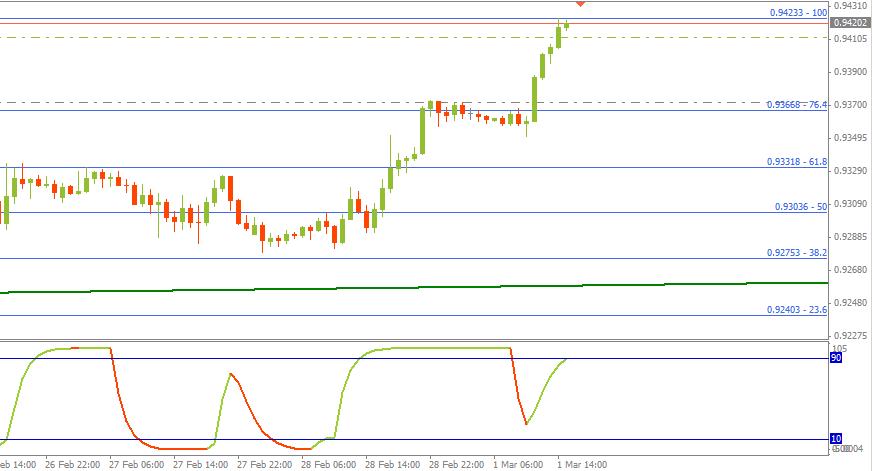
0.94233 is proving to be a hard zone for the pair to breach. The first attempt failed and now the pair is going for a second try. I think it will take a few more kisses before this level can be breached. Placing pending LONG orders couple of pips above this level or waiting for a new candle to open comfortably above this level (a conservative approach) could enable those to get back into this trade.

The target price we're looking at 0.94694 through 0.94861.


EURUSD - Now Targeting 1.28

My previous post under 'Interesting Trades' was on the EURUSD eyeing the 1.29 zone. Well the pair did kiss this region and is currently flirting with 1.30 levels. The chart below shows a further drop is likely to the 1.28 region around the second week of March or perhaps as early as next week.

For those who feel they missed out the trade, look for retracements on Monday and enter.