Showing posts with label schaff trend cycles. Show all posts

EURJPY - A Cautious Approach

The EURJPY Daily and H4 charts shows two Wolfe Wave Patterns, and both contradictory to each other. While the H4 Wolfe Wave pattern shows an upward bullish bias, the Daily chart shows a bearish bias.

The extremities in price shows a possible rally to the 126 price region on the four hour chart while the Daily chart shows a target price around the 98 price region.

So how do we trade such kind of a set up?


The first place to look for is to understand what the Schaff Trend Cycle is telling us.


EURJPY - H4 Chart Shows a Bull Run

On the H4 chart we see a bullish bias formed on the Schaff Trend while the Daily chart shows a bearish bias. One way to interpret this is to assume that price would rally a bit more before turning bearish. From the H4 chart, we see that after price dropped to the 38.2% Fibonacci level, price managed to rally all the way to the 61.8% region. Given that both Wolfe Waves and Schaff Trend analysis are inconclusive, we will have to look to the Fibonacci levels to give a sense of direction.

EURJPY Daily Chart shows a bearish formation
One would assume that price is currently retracing and we can expect to see a bearish rally that could possibly breach the 38.2% level and head to the 23.6% region of 116.883.

From a fundamental perspective, the week ahead is packed with economic events for both the EUR and JPY currencies, starting Monday when we will see economic data from Europe, starting with the Spanish unemployment report along with Thursday when we will have the BoJ's monetary policy statement.

A risky trade would be to wait until H4 Schaff Trend shows a bearish biash and the Daily chart is still bearish. However, this trade would have to be taken with caution because we have the 120.622 as a strong level of support, hinting at a ranging price.

Taking all the above into consideration, it would be sensible to stay off this pair for the moment until a proper direction is formed.

Wolfe Wave Trade Set ups - 3rd March

GBPCHF - H4 Chart, Potential LONG

The 4 hour GBPCHF chart has a wolfe wave already formed. A confirmation can be taken from the sharp change in Schaff Trend Cycle, at Wave 5. However, the Fibonacci Level of 76.4% or 1.42104 was tested and proved to be a strong resistance. A breach of this level will see price heading to 1.42925.

An ideal trade set up would be to wait for a breach of the 76.4% level, preferably a candle opening above this level with stop placed at 1.40926 and take profit at 1.42925.

In terms of risk to reward, this is a risky trade, but the price is likely to be hit. With a bit of caution and monitoring the chart in real time could help in placing a more conservative stop loss.


On the H1 chart, we see another target being formed at 1.42016. A breach above this level should give us the confirmation to go long. Also bear in mind that the Shcaff Trend Cycles for both H1 and H4 are still bearish, so we will wait until the cycle turns bullish.


CHFJPY - Daily Chart, Potential SHORT

The daily chart shows us a wolfe wave being formed along with the Schaff trend cycle confirming a reversal. The potential target for this trade could well be the 91.498, along with the possibility of price further heading down to 89.632.


If we check on shorter time frames, we notice the H1, H4 still showing a bullish bias on the Schaff Trend cycle. Waiting for a bearish turn of the cycle will provide an ideal entry point, which is likely to be between 50% and 38.2% regions.

A stop loss at 101.859 looks safe.

USDCHF - Trade Analysis, 01/03

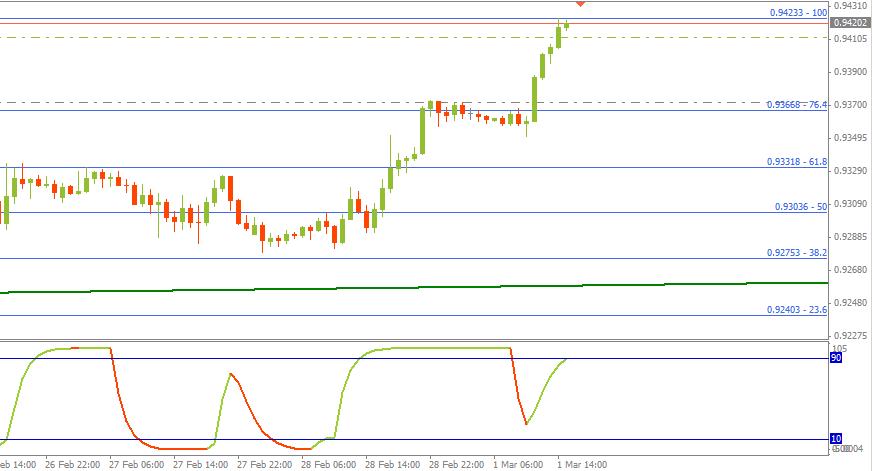
0.94233 is proving to be a hard zone for the pair to breach. The first attempt failed and now the pair is going for a second try. I think it will take a few more kisses before this level can be breached. Placing pending LONG orders couple of pips above this level or waiting for a new candle to open comfortably above this level (a conservative approach) could enable those to get back into this trade.

The target price we're looking at 0.94694 through 0.94861.


Potential Trade Set ups 01/03

There are three really nice trades getting ready. If you have been following my previous posts, you might have guessed that USDCHF, GBPCHF and EURUSD are the three pairs in question.

Let me quickly run you through the set ups.

USDCHF - Bias is Bullish
Currently going through a retracement on the H1 chart. H4 Chart looks steadily bullish. Same with the Daily chart.

It is likely that price could touch 0.93426 or go lower to 0.93283 before going bullish again.

Placing LONG pending orders at both these levels is a decent entry. In terms of position size, let the first level be smaller lot while the second entry be a 1 Lot set up. Either ways, use caution. Stop loss should be 0.92789, yesterday's low.

GBPCHF - Bias is Bullish
Currently going through a retracement on the H1 chart. Price is expected to fall through to 1.41547 or in that region. Our target price is 1.42887.

Place LONG orders at or around the 1.41547 region. A definite confirmation would be 1.423 level.

EURUSD - Bias is Bearish
We expect EURUSD to drop to 1.29 region sometime mid March. Price is currently at 1.307 region. H4 shows a bullish Schaff Trend. So we must wait for the STC to turn bearish. H1 is also bullish, just crossing the 90 region on the STC.

Once H1 and H4 turn bearish, we are good to go.

Potential price entry would be 1.31161 or 1.3018. Our target price would be 1.33169. Its a bit too wide, but use judgement and place your stop accordingly. Yesterday's high was 1.31631, so this can be used a stop level as well.


If you want to grab a cup of coffee or do some errands, now is the right time. Expect some action towards the mid London trading session and definitely during the US trading session.

More to follow towards the end of the day.

GBPCHF H4 Chart, In Trade Analysis

The GBPCHF pair is also currently in a retracement mode. I've closed my trade and managed to get just 8 pips out of it. I'm to be blamed because I was too busy writing up stuff. Anyways, all is not lost. The GBPCHF Daily chart looks to be getting more and more bullish. The 4- hour chart is holding on and we are currently seeing a bearish retracement on the 1-hour chart.


Price could likely move to the 50% Fib for the retracement to end. However, i'll be looking keenly at the Schaff Trend Cycle in order to base my judgement. For those who missed this trade, TODAY is a great opportunity to enter LONG on the GBPCHF. Just wait for this retracement to end and once the STC turns bullish, we're off on our journey.

Fine tuning a trade - Wolfe Wave Trading system

I wrote an article on the Wolfe Wave Trading system. I mentioned that looking to the H4 chart is important in order to enter a trade that you might have missed. Below is the EURUSD chart which is a great example.

The EURUSD Daily chart. The Wolfe Wave set up shows a bearish pattern with price likely to fall.

The black arrows shows where the actual reversal happened. But for those who have missed, there is another point of entry. If you thought it would be great to ride this wave, then wait!! Look at the EURUSD chart on the 4 hour time frame.


We see another Wolfe Wave pattern that is formed. And this one looks bullish. The EPA on this chart shows a potential rise to 1.35424. So if you entered short blindly on the Daily chart, you would have got yourself in a messy situation.

The best entry under this circumstances would be to wait for a bearish bias to happen on the Schaff Trend cycle. Wolfe waves are not accurate all the time, and thus, it is possible that the Wolfe wave will fail on the H4 chart. But let's not 'assume' that to happen. The Schaff Trend cycle tells us that price tried to be bullish, but failed. (Look at the failed bullish cycle).

To be safe, we will place our entry on the EURUSD ONLY after the H4 Schaff Trend goes bearish.

EURCHF, H4 Wolfe Wave Set up

It looks like the CHF pairs are doing quite good in terms of Wolfe Wave patterns. Here is a 4-Hour chart on the EURCHF, which shows a nice uptrending move. So we go for a BUY order.

Entry: I'm sure you have missed the 23.6% Fib level entry @ 1.21968. But fret not, wait for the 38.2% entry @ 1.22678
TP: 1.23251
SL: Either 1.22436 or to be more safe (but more wide), 1.21968

GBPCHF - H4 Chart, 28th Feb

Another potentially good trade is shaping up on the GBPCHF 4 hour chart. Below is the chart with Wolfe Wave, Schaff Trend and also Fibs. I use Fibs mostly to get a perspective of price especially when Wolfe Waves project prices into the future.

What gives me confirmation is from the daily chart, which is showing a potential end of a downtrend for this pair. Refer to the chart below to see what I mean.

Long @ 1.41842
TP: 1.43620 (61.8% Fib)
SL: 1.40926

Risk: 916 Pips
Reward: 1778 Pips

Reason for getting into this trade again is the positive swaps. Call me crazy but I don't like giving away money for free to the markets.. or my broker for that matter!